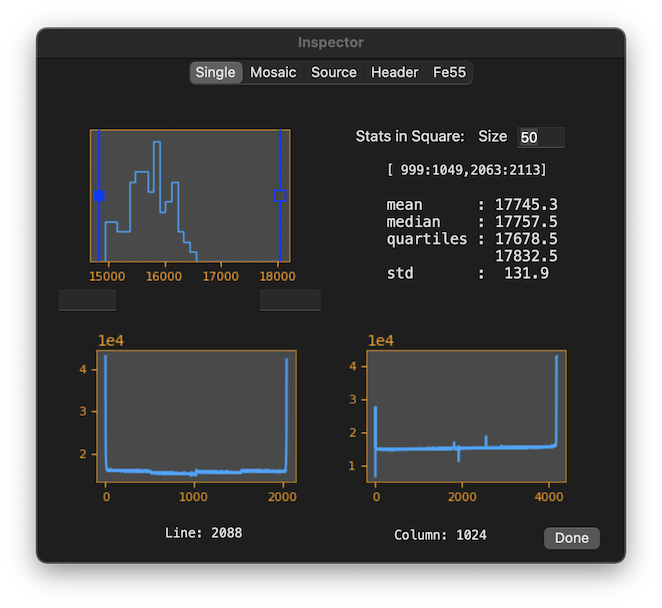
The upper left panel shows the pixel value histogram where the range of pixel value can be changed by putting values in the text boxes below and press return. Vertical bars with a small square show the range of display; the one with an open square and a filled square correspond to white (255) and black (0) respectively. Grab the square to move the location. If the filled one is set higher than the open one, then the black and white is inverted.
Bottom two figures shows column and line profile. You can change the
column by moving the mouse around on the screen with the
Upper right text box shows statistics of pixels in a defined
rectangle. The rectangle location is also changed by the mouse move with
the
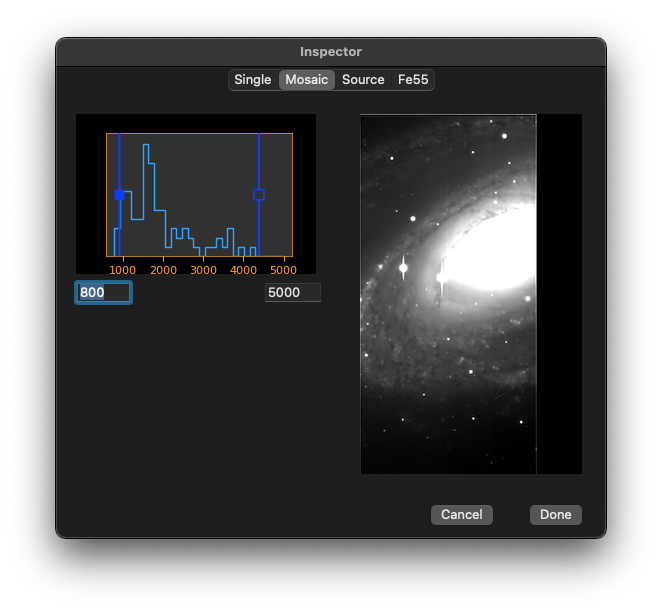
While you read files as mosaic, the inspector panel looks like this. Only
the pixel display level adjustment is available. One of the CCD image is
selected to show on the right to see the adjustment effect. If you want to
select a particular CCD, put the mouse on it and press